Network monitoring for a multi-site business tracks the health of every branch, not just the head office, so an IT team spots a failing link or an overloaded circuit before staff or customers notice.
A retail chain, a hotel group, or a company with several branch offices fails differently than a single-office business: one slow branch can look like a local problem for hours before anyone reports it, while the underlying cause, a saturated WAN circuit or a misconfigured switch, keeps degrading service at every other site on the same link.
Our guide below sets out what to monitor at each site, how alerts should escalate, and how monitoring reports turn into evidence for an SLA conversation with an IT provider.
Why does multi-site monitoring matter more than single-office monitoring?
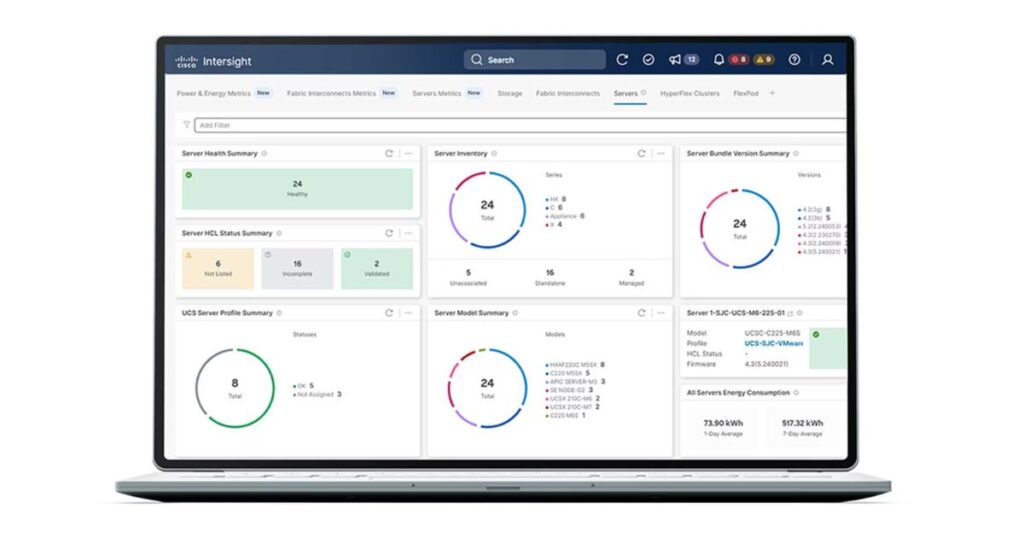
Multi-site monitoring matters more than single-office monitoring because a fault at one branch can point to a shared cause that affects every other location on the same network.
A single office runs one internet circuit and one local switch stack to check when something breaks. A business with several branches shares WAN links, VPN concentrators, and sometimes a single internet service provider across sites in different states, so a congested link at the data center affects a store in Johor Bahru at the same time as one in Petaling Jaya.
Without site-by-site visibility, a manager only learns about a slowdown when a cashier, a receptionist, or a remote worker calls the help desk, and by then the business impact, a stalled point-of-sale queue or a dropped video call, has already happened. Centralized network monitoring collects uptime, bandwidth, and latency data from every branch into one dashboard, which lets an IT team compare sites, spot the pattern behind a recurring complaint, and fix the shared cause instead of chasing one symptom at a time.
What should you monitor across every branch?
Every branch needs the same five categories of monitoring: device and link uptime, bandwidth utilization, latency, WAN and failover status, and security appliance health.
Uptime tracks whether a router, switch, access point, or server at a branch is reachable and responding. Bandwidth utilization tracks how much of the available circuit capacity a site consumes during business hours, which flags a branch that is close to saturating its link before performance drops. Latency and packet loss show whether traffic between a branch and head office or the cloud is slow enough to affect a video call, a cloud-hosted point-of-sale system, or a VoIP line. WAN and failover status confirms that a backup circuit or SD-WAN path activates correctly when the primary link degrades, rather than assuming failover functions until an outage proves otherwise. Security appliance health checks that the firewall, VPN gateway, and endpoint protection at the branch are online and reporting, since a firewall that silently stops forwarding logs leaves a site unmonitored for threats as well as for uptime.
The specifics of what matters most shift by site type, since a retail store, a hotel, and an office branch each run a different mix of critical systems.
| What to monitor | Retail branch | Hotel or hospitality site | Office branch |
|---|---|---|---|
| Device and link uptime | Point-of-sale terminals, payment gateway link, back-office server | Property management system, guest Wi-Fi controller, door access system | File server, VoIP gateway, printers and scanners |
| Bandwidth utilization | Card payment traffic, cloud inventory sync | Guest Wi-Fi demand at check-in and peak occupancy | Video conferencing, cloud application traffic |
| Latency and packet loss | Payment authorization response time | Booking engine and channel manager response time | VoIP call quality, remote desktop sessions |
| WAN and failover status | Backup circuit for card processing during an outage | Failover for booking and reservation systems | Failover for cloud email and file access |
| Security appliance health | Firewall and PCI-relevant segmentation between guest and payment networks | Firewall segmentation between guest Wi-Fi and property systems | Firewall, VPN gateway, and endpoint protection status |
A monitoring platform such as PRTG, or a comparable tool, supports this by running a remote monitoring agent at each branch that keeps collecting data locally and forwards it to a central server, so a site stays monitored even during a temporary loss of connectivity to head office. The tool matters less than the discipline of watching all five categories at every site, since a business that only tracks uptime misses the bandwidth and latency trends that predict a failure before it happens.
How should alert thresholds and escalation work?
Alert thresholds and escalation should trigger a warning well before a metric crosses the point where users notice a problem, then escalate automatically if nobody acts.
A practical structure sets a first threshold, for example bandwidth utilization sustained above a set percentage of circuit capacity, or latency above a level that affects VoIP call quality, and sends a low-priority notification to the monitoring queue. If the condition persists or worsens, the alert escalates to a named on-call engineer, and if it remains unresolved past an agreed window, it escalates again to a team lead or account manager. This tiered structure prevents alert fatigue from paging someone on every minor fluctuation and prevents a missed outage from a single alert sitting unread in an inbox.
Escalation rules should route by severity and channel, a chat notification for a minor bandwidth spike, a phone call or page for a branch that goes fully offline. A branch running a payment terminal or a hotel booking engine needs a shorter escalation window than a branch printer, because the cost of downtime differs by system.
At Callnet Solution, we design monitoring setups that priorities meaningful alerts, using trusted platforms from partners such as PRTG, Dynatrace, Cisco, Aruba, ManageEngine, SolarWinds, and Splunk. These tools give Malaysian businesses the visibility they need without drowning IT staff in noise.


How does monitoring prevent outages instead of just reporting them?
Monitoring prevents outages instead of just reporting them when the data feeds a proactive response, not only a historical record. A dashboard that shows a branch’s bandwidth utilization trending upward over several weeks lets an IT team upgrade the circuit before the link saturates during a busy season.
Tracking WAN and failover status continuously, rather than assuming the failover path functions, catches a path that silently stopped forwarding traffic, so the business is not surprised by a full outage the first time the primary link actually fails.
Security appliance health monitoring plays the same role for cybersecurity: a firewall that stops reporting logs or a VPN gateway running an outdated certificate is a gap that an attacker can exploit long before it causes an obvious outage, so catching the gap through monitoring closes it before an incident occurs.
Regular network monitoring across branches turns troubleshooting from a reactive scramble into a scheduled maintenance task based on trend data, which reduces both the frequency and the length of outages.
How do monitoring reports support SLA conversations?
Monitoring reports support SLA conversations by giving both the business and the IT provider a shared, factual record of uptime, response time, and incident history instead of a dispute based on memory.
A monthly or quarterly report that lists uptime per branch, average response time to alerts, and time to resolve each incident lets a business hold its provider accountable to the response and resolution targets in the contract. The same data protects the provider when an outage traces back to a cause outside its control, such as a public utility fault or an internet service provider’s own circuit failure at a specific branch.
A business unsure of what its current managed IT services provider actually reports each month should ask for a sample report before renewing the contract.
Regular review of these reports keeps both sides focused on trends across every site rather than a single dramatic outage. Where monitoring logs capture network activity tied to identifiable staff or guests, such as authentication records or guest Wi-Fi session logs, PDPA 2010 governs how long that data is retained and who can access it, so a business should confirm its provider’s log retention policy as part of the SLA discussion.
How do you roll out monitoring across multiple sites?
Rolling out monitoring across multiple sites succeeds as a phased project rather than a single simultaneous switch-on. Start by inventorying every device, circuit, and application at each branch, including sites across the Klang Valley, Selangor, Johor, Penang, and other parts of West Malaysia, so the monitoring platform has an accurate baseline before it flags anomalies.
Deploy monitoring to a small group of representative sites first, one retail store, one office branch, and one hotel property if the business operates across those formats, to validate thresholds against real traffic patterns before expanding further. Once thresholds are tuned, extend the rollout to the remaining branches in batches, checking that each new site reports correctly into the central dashboard rather than assuming the configuration carries over automatically.
A business that lacks the internal staff to manage this rollout, tune thresholds, and staff the escalation queue around the clock typically hands the project to a provider that already runs this discipline across other clients, which shortens the time to a stable, tuned monitoring setup.
What should you do next?
A multi-site business that is still waiting for branch managers to report problems by phone is running its network on guesswork instead of data. If your organization is exploring system monitoring solutions in Malaysia, we can help implement and optimize the right mix of platforms — whether that’s PRTG for visibility, Cisco and Aruba for network health, Dynatrace for deep diagnostics, or Splunk for log analytics. Our role is to simplify complexity and make monitoring a business enabler, not a burden.
Explore our System Monitoring solutions in Malaysia or contact us for a free consultation today.